Nigeria Urban Mobility and Ride-Hailing Market Shifts From App Growth to Trip Economics
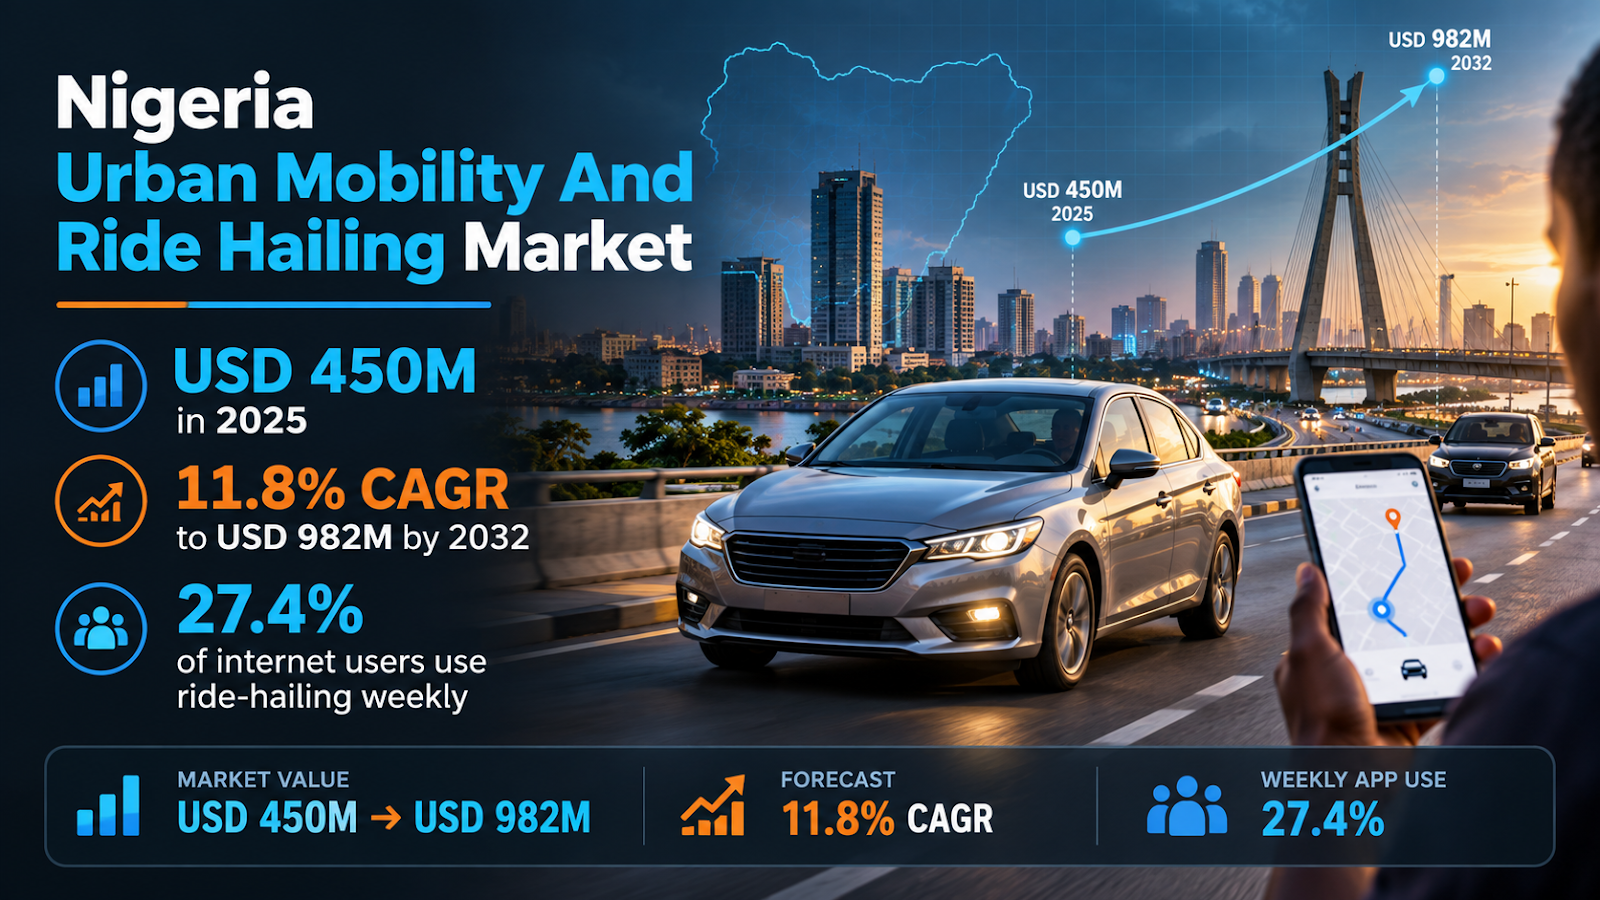
Nigeria’s Ride-Hailing Growth Is Getting Harder to Monetize: Ken Research Maps the Shift Toward Recurring Mobility
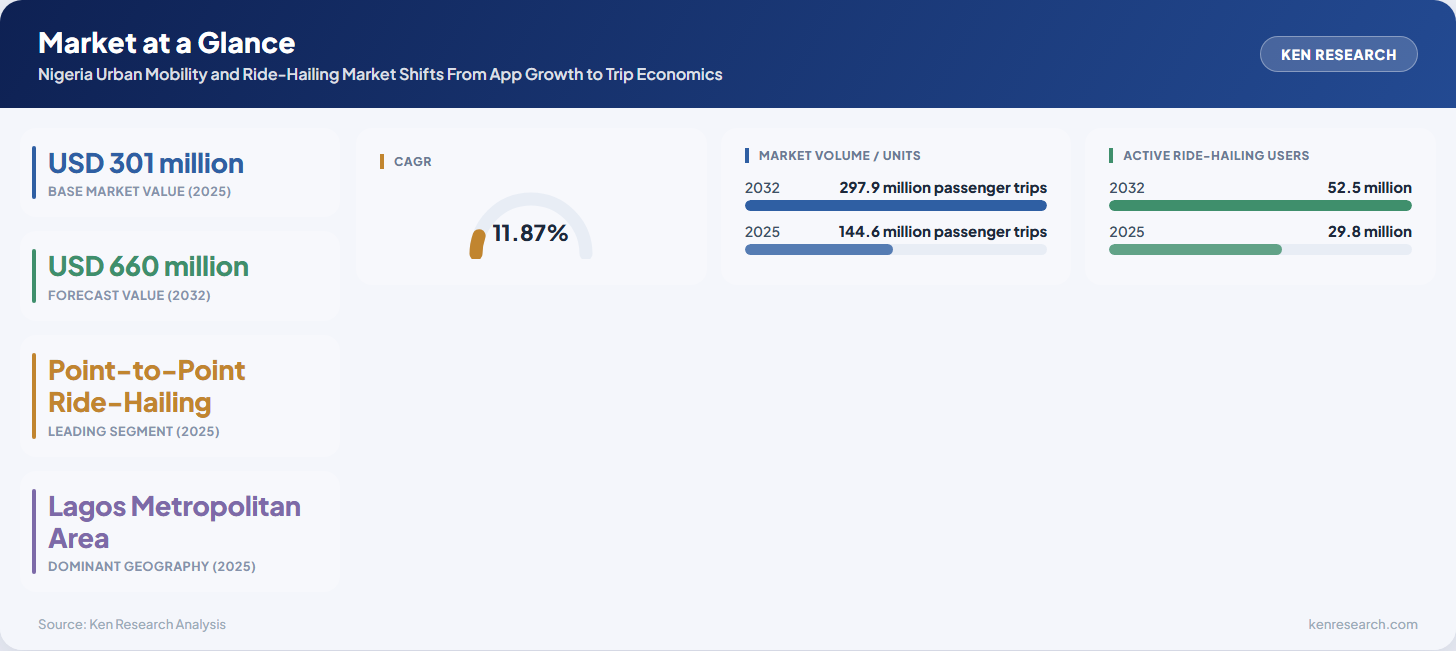
Nigeria’s app-based passenger-mobility market has moved beyond its early adoption phase. The latest Ken Research framework values the market at USD 301 million in 2025 and projects it to reach USD 660 million by 2032, representing an 11.87% forecast CAGR. The commercial question is therefore changing: platforms no longer need only to prove that Nigerians will book rides digitally; they need to convert digital reach into repeat trips, reliable driver liquidity and better revenue quality.
The forecast points toward a more diversified mobility economy. Everyday point-to-point rides remain the principal commercial pool, but incremental value is expected to move toward scheduled commuting, corporate transportation, airport and premium journeys, negotiated-fare formats and fleet-linked services. This matters because recurring mobility can improve vehicle utilization and reduce dependence on repeated consumer acquisition while supporting higher-value journeys.
The counter-thesis is that a large addressable population does not automatically produce attractive platform economics. Fuel, financing, maintenance, regulation and household affordability all influence whether drivers can remain active at fares riders will accept. That tension also connects ride-hailing to the Nigeria Used Car Market, where approximately 689,000 vehicle transactions are modeled for 2025 and vehicle access remains closely tied to affordability, inspection and finance. The mobility-market scope here covers digitally booked point-to-point, scheduled shared, corporate and other platform-mediated passenger journeys; transport booked entirely offline is excluded.
App Adoption Is No Longer the Scarce Asset
The installed digital audience is already meaningful. The current model estimates 29.8 million active ride-hailing users in 2025, rising to approximately 52.5 million by 2032. Nigeria also recorded 134.78 million internet subscriptions in October 2024, giving mobility platforms a much larger connected audience than the pool already transacting through ride-hailing services.
This changes acquisition strategy. The highest-value problem is increasingly not basic app discovery but conversion from occasional use into dependable mobility behavior. Price transparency, driver availability, pickup reliability, safety, payment success and predictable service quality determine whether an installed app becomes a frequent transaction relationship. Lagos remains the dominant geography because rider concentration and driver density reinforce each other, but incremental demand can deepen as Abuja, Port Harcourt, Ibadan, Benin City and other urban markets build sufficient liquidity.
From Downloads to Frequency
A mobility platform creates stronger economics when the same rider books more often and when each additional trip can be served without proportionally increasing acquisition expense. Scheduled work journeys, employer-funded transport and recurring airport or business use therefore matter differently from one-off consumer rides. They create an opportunity to monetize reliability and predictability rather than competing only for the cheapest immediate fare.
Trip Density Is Becoming the Real Growth Engine
Passenger trips are modeled to rise from 144.6 million in 2025 to approximately 297.9 million in 2032. That implies roughly 10.88% annual volume growth, slightly below the market’s 11.87% value CAGR. The difference is strategically important: the forecast does not rely only on more rides, but on a gradual improvement in revenue mix.
The modeled blended fare rises only from approximately USD 2.08 per trip in 2025 to USD 2.21 in 2032. That is not a premiumization story built on aggressive fare inflation. Instead, higher-value airport, corporate, scheduled and premium journeys are expected to lift average realization while mass-market economy rides preserve the transaction density needed for driver matching. Operators that protect liquidity while selectively expanding higher-value formats are better positioned than those that treat every ride as economically identical.
Payments Reduce Friction, but They Do Not Solve Fare Sensitivity
Nigeria’s payment infrastructure increasingly supports app-mediated mobility. The Central Bank of Nigeria reported approximately 5.63 billion NIBSS Instant Payment transactions in H1 2024, alongside continued migration toward electronic channels. For ride-hailing, this reduces friction around in-app settlement, driver payouts and digitally coordinated transactions, even though cash can remain relevant for individual journeys.
The broader Nigeria Mobile Payments and FinTech Ecosystem Market adds useful context: it cites nearly 11 billion NIP transactions in 2024 and 147.5 million mobile internet subscriptions by December 2025. The implication for mobility operators is that payment access is becoming less of a structural bottleneck. The harder problem is affordability: digital checkout can make a trip easier to complete, but it does not make an uneconomic fare affordable for riders or profitable for drivers.
Driver Economics Will Decide Which Growth Is Durable
Ride-hailing marketplaces need enough drivers online, in the right locations, at the right times. That makes driver contribution economics a core demand-side issue as well as a supply-side one. Fuel expenses, vehicle financing, maintenance, platform commission and idle time determine whether a driver can remain active without requiring fare increases that suppress passenger frequency.
- Fuel exposure: High-mileage drivers experience energy-price changes immediately, making fuel efficiency a direct contributor to platform liquidity.
- Vehicle financing: Monthly repayment burdens raise the trip volume required to achieve a viable driver income.
- Maintenance: Older or heavily utilized vehicles can create downtime that removes supply from the network precisely when demand is strongest.
- Commission structure: Lower platform take rates may attract drivers, but platforms still need enough monetization to fund acquisition, technology, safety and support.
- Idle time: Dense matching can improve effective earnings even without increasing the headline fare.
Alternative-Fuel Fleets Change the Break-Even Equation
Clean-fleet infrastructure could alter this cost structure. Nigeria’s official Pi-CNG & EV programme reports more than 120,000 vehicle conversions, over 400 certified conversion centres and more than 90 CNG refuelling stations in 2026. For high-utilization mobility vehicles, lower running costs can potentially improve driver contribution margins, support financing capacity and reduce pressure to pass every fuel shock through to passengers.
The opportunity extends beyond cheaper fuel. Platforms, leasing companies, lenders and fleet managers can attach financing, conversion, maintenance, telemetry and vehicle-subscription services to the underlying trip relationship. That creates a route toward revenue that is not solely dependent on taking a percentage of each consumer ride.
Competition Is Resetting Around Liquidity, Contracts and Fleet Control
The competitive structure is also changing. Uber’s withdrawal from Nigeria in September 2026 removes a long-standing international participant from the active market and creates room for surviving networks to absorb riders and drivers. The current report identifies Bolt, inDrive, LagRide, Shuttlers and Treepz among the major operating companies, but their models are not identical: competition spans immediate dispatch, negotiated fares, managed fleets, scheduled employee transport and group mobility.
Recurring Mobility Reduces Acquisition Dependence
Corporate and scheduled transport can be commercially attractive because demand is contracted or repeated rather than reacquired journey by journey. Employers value reporting, route reliability and service-level performance, while operators gain denser recurring routes and more predictable vehicle utilization. The operating question therefore becomes how much of the network can be shifted from uncertain consumer dispatch into repeatable mobility relationships without sacrificing the liquidity of everyday rides.
This model overlaps with the Nigeria Fleet Management Analytics Market, where analytics-enabled subscriptions are projected to rise from approximately 160,000 vehicles in 2025 to about 372,000 by 2032. Driver scoring, predictive maintenance, utilization analytics and API-connected fleet systems can become economic infrastructure for mobility operators rather than optional back-office technology.
Regulation Is a City-by-City Operating Cost
Nigeria does not operate as one uniform ride-hailing compliance market. The current mobility research identifies state-level operator licensing and trip-level regulation, with operators serving Lagos and Abuja required to navigate distinct local regimes. That increases onboarding, legal and reporting complexity as platforms expand geographically and weakens some of the scale advantages that a single national compliance framework could otherwise provide.
Data governance creates a second layer. Ride-hailing platforms process location, identity, journey and payment-related information, bringing their systems within Nigeria’s national privacy framework. The Nigeria Data Protection Commission states that the Nigeria Data Protection Act 2023 applies to organizations operating in Nigeria and to personal-data processing within the country. For mobility operators, privacy controls, documented processing practices, secure driver verification and accountable data-sharing processes increasingly belong inside the operating model rather than being treated as a legal afterthought.
What Mobility Operators and Investors Should Watch Through 2032
The forecast remains attractive, but headline market growth alone will not show whether the ecosystem is becoming economically stronger. Decision-makers should monitor indicators that connect rider demand with fleet availability, driver contribution margins and recurring revenue.
- Trips per active rider: Rising frequency would demonstrate deeper usage rather than growth driven mainly by new accounts.
- Active driver liquidity: Driver availability and pickup times reveal whether fares and operating costs are sustaining adequate supply.
- Blended fare versus driver cost: A widening mismatch would increase pressure for price adjustments or lower commissions.
- Corporate and scheduled mobility penetration: Growth here would indicate a shift toward recurring, contract-like revenue.
- CNG and EV fleet adoption: Alternative-energy vehicles can change the break-even economics of high-mileage operations.
- Regulatory complexity: New state-level requirements, data obligations or trip levies can alter the cost of geographic expansion.
Market Outlook: Growth Persists, but the Profit Pool Moves
The modeled market expands from USD 301 million in 2025 to USD 660 million in 2032, yet the expected 11.87% CAGR is below the 14.49% historical CAGR recorded across 2020–2025. That moderation is analytically important. Nigeria is moving out of a recovery-and-adoption phase and toward a market where growth must increasingly be earned through frequency, utilization, differentiated service formats and improved driver economics.
The upside case rests on deeper rider frequency, corporate outsourcing, scheduled commuting, cleaner fleet economics and better integration between platforms, financing and fleet technology. The downside case is equally tangible: if fuel and vehicle costs force fares upward faster than household budgets can absorb them, drivers may leave networks or riders may reduce trip frequency. The most valuable operators will therefore be those that can balance the economics of both sides of the marketplace rather than maximizing only bookings, drivers or headline market share.
Don’t miss the next maps the shift toward recurring mobility shift. Ken Research continuously publishes new market intelligence, forecasts and industry analysis. Add Ken Research as a Preferred Source on Google to discover more of our research when your next market question comes up.
Research Basis and Data Status
The selected dataset is the current August 2026 Ken Research Nigeria Ride-Hailing & Mobility Platforms framework. It uses 2025 as the base year, a historical period of 2020–2025 and a forecast period of 2025–2032. Market values, passenger-trip estimates, active-user counts, blended fares and forecasts cited from that framework are proprietary estimates and should not be interpreted as government statistics.
The published methodology combines desk research, primary industry research and validation. Respondent groups include ride-hailing managers, fleet owners and driver representatives, corporate mobility buyers, regulators and policy stakeholders. The validation stage reconciled 280 stakeholder survey responses and cross-checked trip, user, fare and city-level supply assumptions. Official payment, data-protection and clean-mobility statistics used in this article are separately attributed to their respective institutions.
Research Framework
- Digital ride-booking benchmark review
- Lagos and FCT licensing-regime mapping
- Driver commission and fare-model benchmarking
- CNG and EV fleet-transition tracking
- Primary interviews across operators, fleets, corporate buyers and regulators
- Trip, user and fare reconciliation
- Forecast and adoption-curve validation
Explore the Nigeria Ride-Hailing & Mobility Platforms Market report for detailed segmentation, competitive coverage, operating benchmarks and forecast assumptions.


Comments
Post a Comment