South Africa Freight Transportation Market Moves Into a Reform-Led Value Growth Phase
Freight Growth Is Becoming a Network-Efficiency Story: Ken Research Maps South Africa’s Shift Toward Higher-Value Transport
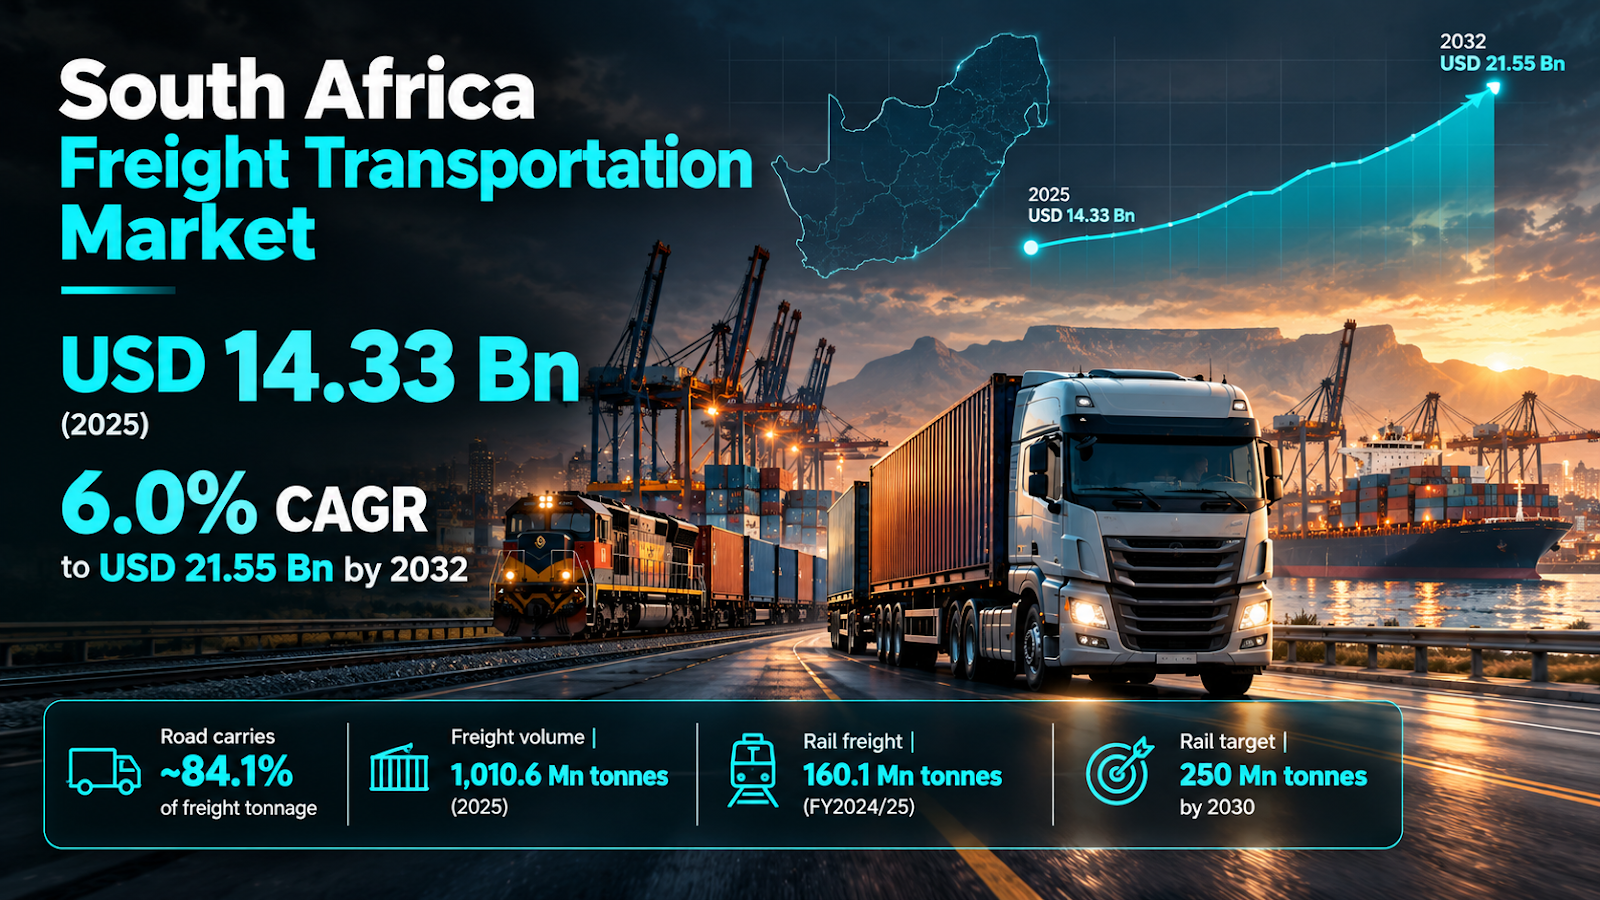
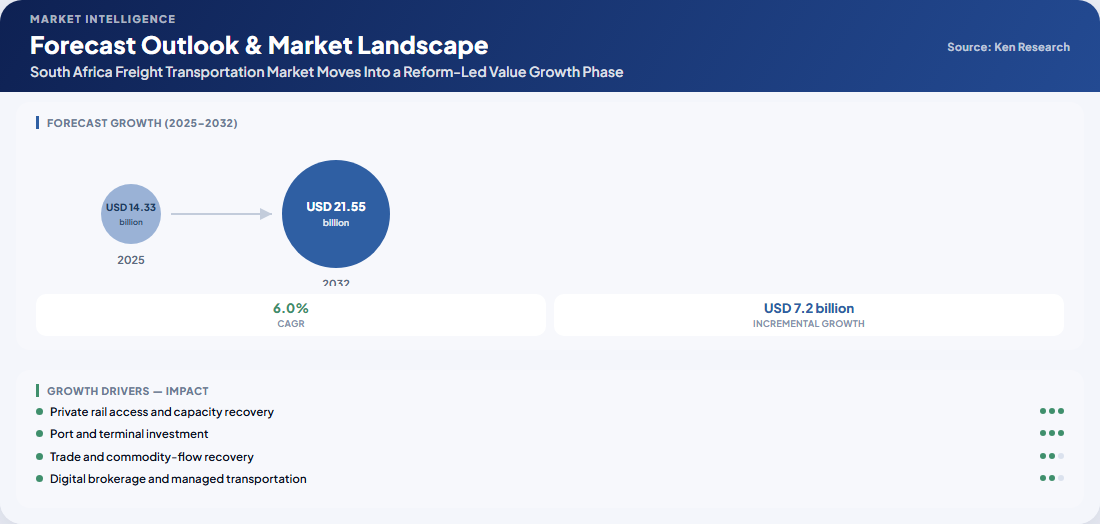
South Africa’s freight transportation market is moving into a phase where the value of better network utilization may matter as much as the quantity of cargo moved. Proprietary estimates from Ken Research value the market at USD 14.33 billion in 2025 and project it to reach USD 21.55 billion by 2032, representing a 6.0% CAGR. The central commercial shift is not simply more freight: modeled market value is expected to expand faster than physical tonnage as rail reform, service mix and multimodal coordination create additional revenue per shipment.
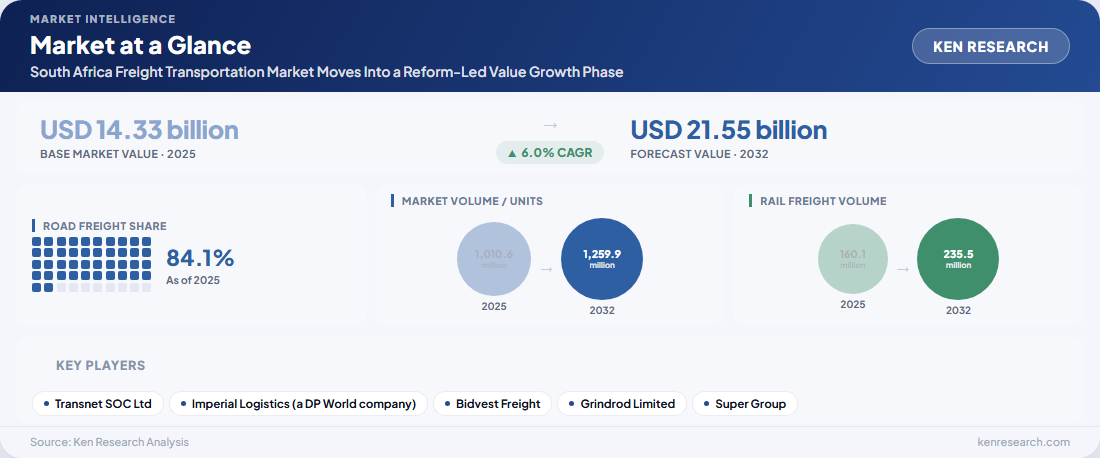
The underlying freight base is already substantial. Approximately 1,010.6 million tonnes are modeled to move across the market in 2025, while road freight accounts for roughly 84.1% of physical tonnage. By 2032, total freight volume is projected at approximately 1,259.9 million tonnes, implying a physical-volume CAGR of about 3.2%—well below the modeled value-growth rate. The market scope includes road, rail, maritime and air freight transportation together with freight forwarding, customs brokerage and intermodal coordination.
That divergence between revenue and tonnage is the opportunity, but it is also the forecast’s main execution test. Rail and port reliability, asset availability, corridor congestion and road operating costs can still prevent theoretical capacity from becoming productive throughput. The broader South Africa logistics market provides useful context: rail reform, port modernization and outsourcing are simultaneously reshaping the wider service environment, increasing the value of operators that can coordinate transport rather than merely provide isolated capacity.
Why Revenue Can Grow Faster Than Freight Tonnage
The modeled forecast contains an important distinction. Market value rises from USD 14.33 billion in 2025 to USD 21.55 billion in 2032, while physical volume increases from approximately 1,010.6 million tonnes to 1,259.9 million tonnes. The gap implies that future growth depends partly on pricing and mix: higher-value forwarding, containerized movements, managed transportation, intermodal coordination and tariff-linked services can expand revenue without requiring tonnage to grow at the same pace.
Blended revenue per tonne illustrates the mechanism. The proprietary model places it at approximately USD 14.18 in 2025 and projects it to reach about USD 17.10 by 2032. For carriers and logistics groups, this shifts strategy away from a pure volume race. Route density, backhaul utilization, service reliability, data visibility and the ability to bundle transport with coordination services become increasingly important determinants of revenue quality.
This mechanism also appears in the broader South Africa transportation services market, where rail access, integrated transport technologies and intermodal reform form part of the longer-term growth case. Freight operators therefore face two simultaneous questions: how much capacity can they control, and how much additional service value can they attach to each movement?
The commercial upside is increasingly tied to turning freight capacity into a more coordinated, reliable and higher-value service rather than relying on tonnage expansion alone.
Road Dominance Creates Scale—and a Large Modal-Shift Exposure
Road freight remains the operational backbone of South African cargo movement. Its estimated 84.1% share of 2025 physical tonnage reflects the flexibility of trucking across dispersed mines, farms, factories, distribution centers and retail destinations. Road transport also compensates for gaps in rail availability, allowing shippers to protect production schedules even when the alternative comes with higher fuel, toll, maintenance and congestion exposure.
Official data reinforce why this remains commercially significant. The Statistics South Africa Land Transport Survey reported that freight-transport income increased by 5.2% year on year in the fourth quarter of 2025. Yet seasonally adjusted road payload declined by 1.3% from the previous quarter while rail payload increased by 3.6%. The figures do not establish a permanent modal shift, but they show why operators need to watch changes in modal utilization rather than assume road’s current dominance will remain economically static.
What Road Operators Need to Defend
- Backhaul density: empty return legs weaken margins even when headline freight demand is strong.
- Fleet availability: maintenance discipline becomes more valuable when customers depend on road service to compensate for rail constraints.
- Fuel and toll recovery: contract structures must absorb volatile operating costs without damaging customer retention.
- Service differentiation: tracking, proof-of-delivery, compliance and shipment visibility can defend margins as basic hauling capacity becomes easier to compare.
- Intermodal positioning: road operators may gain from rail recovery where they become feeder, terminal or first- and last-mile partners rather than competing exclusively against rail.
The strategic implication is therefore more nuanced than “rail gains, road loses.” Successful rail reform can change which journeys are economically rational for trucks. Long-haul bulk cargo can migrate toward rail while road fleets concentrate on collection, distribution, terminal drayage, regional routes and time-sensitive shipments where flexibility commands a premium.
Rail Reform Changes the Economics of the Network
Rail is the largest swing factor in the market outlook because South Africa has meaningful latent cargo demand but has historically been constrained by infrastructure reliability, rolling-stock availability and network performance. Proprietary market modeling places rail freight at approximately 160.1 million tonnes around the 2025 base period and projects approximately 235.5 million tonnes by 2032. That trajectory would materially alter the freight mix even while road remains the largest carrier.
The reform process has moved beyond policy design. At the National Transport Conference in March 2026, the South African Government stated that slots covering up to 24 million tonnes of annual freight had been conditionally awarded to 11 train operating companies. A subsequent government update said the operators had been approved on 13 March 2026, with operations expected to commence on 1 April 2027.
Why Open Access Matters Beyond Rail Operators
The economic effect extends into leasing, maintenance, terminals, warehousing, forwarding and road feeder services. Additional train paths require locomotives and wagons, but commercially useful capacity also depends on synchronized terminals, cargo contracts, port slots and reliable first- and last-mile connections. This makes the opportunity an ecosystem problem rather than simply a rail-volume story.
- Mining exporters gain additional options for high-volume corridor capacity.
- Rolling-stock providers gain demand for locomotives, wagons and maintenance.
- Terminal operators can benefit from higher transfer and handling activity.
- Road carriers can reposition toward feeder and distribution legs.
- Forwarders can build multimodal products around more predictable scheduled capacity.
The counter-risk is timing. Awarding access does not automatically create usable capacity. Infrastructure condition, signaling, rolling stock, terminals and port interfaces must all perform sufficiently well for approved train paths to become dependable commercial services. Forecast upside therefore depends more on execution than on policy announcements alone.
Higher-Value Freight Services Sit Around the Physical Movement
The fastest-growing commercial layers are increasingly found around the shipment itself. The primary research identifies digital freight brokerage as the fastest-growing business-model segment through 2032. Load matching, digital tendering, carrier verification, tracking and managed procurement can improve utilization across a fragmented road-freight base without requiring the platform to own every truck it coordinates.
Forwarding provides another layer of value. Regional research on the Africa freight forwarding market highlights South Africa’s role as a major Southern African gateway for customs, ocean forwarding and road-feeder activity. For freight providers, the implication is that border documentation, customs brokerage, exception management and multimodal orchestration can become meaningful revenue pools alongside the physical carriage charge.
The Emerging Service Stack
- Capacity procurement: matching contracted and spot capacity to shipper demand.
- Shipment visibility: providing customers with event-based tracking and exception alerts.
- Customs coordination: reducing documentation friction on cross-border freight.
- Intermodal planning: combining road, rail, port and forwarding options.
- Performance analytics: measuring carrier reliability, dwell time and route economics.
- Managed transportation: coordinating multiple providers through a single operating layer.
This favors businesses that can turn fragmented physical capacity into an auditable service network. The competitive advantage is no longer only fleet size; it increasingly includes the ability to integrate capacity, information and compliance into a predictable customer outcome.
Competition Is Fragmented in Capacity but Concentrated Around Critical Infrastructure
The market combines very different competitive models. The primary research profiles Transnet SOC Ltd, Imperial Logistics as part of DP World, Bidvest Freight, Grindrod Limited, Super Group, Unitrans Supply Chain Solutions, Value Logistics, DHL Global Forwarding South Africa, DSV South Africa and Santova Limited as notable participants. No unsupported company-level market shares are used here; the report instead points to a broad ecosystem exceeding 24,000 participants and owner-operator units across the freight economy.
This creates a structural contrast. Road capacity is highly fragmented, while strategically important rail, port, terminal and integrated logistics assets are much harder to replicate. Approximately 70% of the modeled competitive mix is classified as local, versus 30% regional or international, and the research records 8 new entrants over the previous 5 years. Entry is therefore possible, but the barriers differ sharply by business model.
Asset-light entrants can compete through brokerage, forwarding, technology and specialized corridor services. Asset-heavy players must solve financing, utilization and infrastructure-access economics. Integrated groups have another advantage: a customer buying road transport, customs, port handling and forwarding through one provider creates more cross-selling opportunity and potentially lower coordination cost than a collection of unrelated point services.
The Biggest Constraint Is Whether Infrastructure Recovery Keeps Pace With Demand
The bullish interpretation of the forecast is that underused infrastructure and private participation create a long runway for productivity recovery. The opposing view is that persistent infrastructure limitations may continue shifting freight onto expensive road networks while constraining mining, manufacturing and export throughput. Both conditions can coexist: freight-service revenue can rise even while the physical system remains inefficient, because shippers may pay more to work around bottlenecks.
That distinction matters for investors. Higher nominal freight revenue is not automatically evidence of better system productivity. Operators need to separate growth generated by additional cargo, improved service mix and utilization from growth generated by higher tariffs or rising operating costs.
A freight market can become larger without becoming proportionately more efficient; the quality of the growth therefore depends on how much additional throughput and reliability infrastructure reform actually releases.
What Freight Operators and Investors Should Watch Through 2032
The forecast is best treated as an operating framework rather than a single market-size endpoint. Several indicators will reveal whether South Africa is moving toward the modeled higher-value, more multimodal freight system or merely absorbing rising costs inside the existing structure.
- Rail tonnage: sustained movement toward the modeled 235.5 million tonnes by 2032 would indicate genuine modal recovery.
- Private rail starts: commercial commencement by approved train operating companies will show whether open access is translating from allocation into actual services.
- Port productivity: better terminal performance is necessary for incremental rail capacity to convert efficiently into export and import flows.
- Road share: a gradual reduction from the current highly road-dependent mix would indicate successful rebalancing rather than freight-demand weakness alone.
- Revenue per tonne: growth toward approximately USD 17.10 by 2032 should ideally reflect service enrichment and mix rather than cost inflation alone.
- Digital brokerage adoption: stronger use of load matching and managed transportation would signal improved monetization of fragmented capacity.
- Backhaul and corridor utilization: higher utilization is critical for converting network density into sustainable operator margins.
Market Outlook: The Upside Comes From Rebalancing the System, Not Simply Expanding It
The base case takes the South Africa freight transportation market from USD 14.33 billion in 2025 to approximately USD 21.55 billion by 2032, a modeled CAGR of 6.0%. Physical freight volume grows more slowly, which makes service mix, infrastructure access and operating productivity central to the revenue story. Road will remain indispensable, but a healthier rail system could redistribute long-haul bulk flows and create new feeder, terminal and multimodal opportunities around it.
The strongest upside scenario would combine reliable private rail operations, improved port interfaces, greater intermodal coordination and increased adoption of digital procurement and visibility services. The downside scenario is more familiar: rail recovery proceeds slowly, infrastructure bottlenecks remain persistent, and operators continue absorbing diesel, maintenance, congestion and equipment costs through a road-heavy network.
For management teams, the forecast therefore translates into a strategic choice about where to build capability. Owning assets remains valuable where utilization can be secured, but orchestration capability—connecting carriers, terminals, rail, customs, data and customers—can capture revenue without replicating every physical asset. The emerging opportunity sits at the intersection of capacity and coordination.
Don’t miss the next south africa’s shift toward higher-value transport shift. Ken Research continuously publishes new market intelligence, forecasts and industry analysis. Add Ken Research as a Preferred Source on Google to discover more of our research when your next market question comes up.
Research Basis and Data Status
The primary market framework was published in September 2026 with 2025 as the base year and a forecast period extending through 2032. Market values, forecast values, segment conclusions, participant counts and revenue-per-tonne estimates in this article are proprietary Ken Research estimates rather than official government statistics. Official freight indicators and rail-reform milestones are sourced separately from Statistics South Africa and South African government publications.
Research Framework
- Review of national freight-policy instruments.
- Analysis of rail-throughput disclosures and merchandise-trade flows.
- Benchmarking of operator financial and operating indicators.
- Primary interviews with freight operations directors, rail network planners, cargo procurement managers and customs-brokerage executives.
- Validation across 400 respondents.
- Reconciliation of revenue and tonnage estimates.
- Corridor-level operating-economics checks and stress testing of rail-recovery assumptions.
The modeling distinguishes the proprietary service-provider revenue estimate from government statistics measuring physical freight activity. This separation is important because official rail and road tonnage data describe transport activity, while the market estimate incorporates the commercial value of freight transportation, forwarding, brokerage and intermodal coordination within the report’s defined boundary.
Explore the South Africa Freight Transportation Market report for detailed segmentation, competitive coverage, market modeling and forecast assumptions.


Comments
Post a Comment